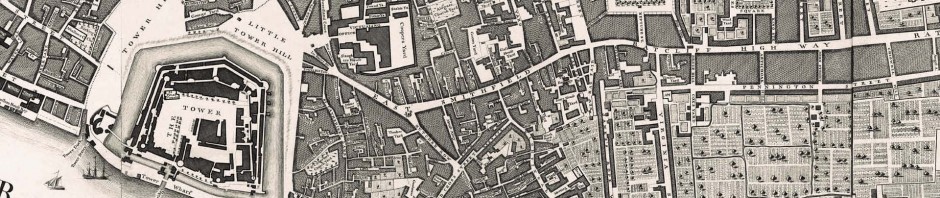
One of MoLA’s most tangible project deliverables, was a fully articulated and geo-referenced version of John Rocque’s 1746 map of central London and its immediate environs. This map covers an area of roughly 9 by 3kms, and was created between 1737 and 1746. For the time, it used the most accurate methods of survey then available and was also the first truly trigonometrically based survey of the urban area. A trigonometric survey is based on the principle that if you have two points a known distance apart, you can determine the location of a third by observing angles to it from the two known points. The next post will look at the technique in more detail.
In an advert made for the map made in 1755, both the President and Secretary of the Royal Society considered it an injustice, not to acquaint the public with the quality of measurement the cartographers had achieved;
‘ they have in our Presence taken the true Bearings of a very great number of Steeples and other remarkable Places from different Stations with an excellent instrument .. and that they have the proportional distances of a great many Points in different and very distant Parts of Town computed trigonometrically, to which computations they have strictly confined their map’ [1]
Our work comprised two basic tasks; the articulation of the map’s 24 individual sheets with each other, and the geo-referencing of the resultant single image to the real world. ‘Real world’ here having the meaning of Ordnance Survey mapping. Here we’ll look at the first of these tasks.
The 24 individual sheets
An important thing to realize here is that the map sheets were created individually. That is, possibly counter-intuitively, the sheets were not printed from a single connected drawing which was then ‘cut up’ to fit the published format used (c.50 x 70 cm). While the survey itself was of course executed in a connected manner across the area, each printed sheet started as a draft drawing of part of that area (roughly 1.1 x 1.3 km in size), which was overlain on a waxed metal sheet (normally copper), and lines traced by hand downward. The map was then hand engraved and titles impressed onto the plate with a punch. Ink was then placed in the incised lines and letters, damp paper overlain, pressure applied, and the paper picked up the ink. The sheets were then left to dry, and would naturally shrink somewhat. Importantly, this shrinkage was not an even process across the sheet.
There are a number of existing online examples where the 24 sheets of this Rocque map have been placed together to create a composite view of the entire area. They are invariably hampered by three factors. Firstly the sheets are often poorly edged matched. Some attempts use completely un-cropped sheet scans which include the paper around the map, plus the reference markers and numbers directly on the edge of the cartographic area itself. Secondly, attempts have not been made to compensate for the differential shrinkage noted above. Finally, and most poignantly for this project, existing on-line examples only articulate the sheets with each other as a graphical exercise, rather than mapping them to the geographical reality.
The first two graphical tasks were carried out in Adobe Photoshop. Each sheet existed as a TIF file, and had to be processed individually, since as well as the variation in sheet height and width caused by differential shrinkage, there was also variation in precisely where the printed area appeared on the paper. Each scan was trimmed to the edges of the actual cartography (as opposed to the engraved edge reference numbers and marks) and the trimmed widths noted. These trimmed widths were recorded because the project wished to utilize an existing index of street and place names that had been created for the map on a per-sheet basis, by Patrick Mannix of Motco. This index recorded those locations using the sheet’s raster grid as pairs of pixel coordinates. Since the pixel coordinate system’s origin was the top-left corner of the scan, coordinate values would therefore need to be reduced by the number of pixels removed from the top and left sides of the scan to maintain their correct location on the trimmed version of the scan.
The trimmed scans then needed to be placed in their correct relative position to each other. This was first attempted using a GIS-based raster registration technique commonly used to display adjacent raster scans as a continuous layer, for example ordnance survey 1;10,000 mapping tiles. The relative location of each scan to its neighbours, could be calculated since we knew the pixel dimensions of each scan and where it existed in the 8 x 3 grid of sheets. However, all this achieved was to highlight the effect of differential paper shrinkage, manifest in poor edge mapping due to one sheet being a slightly different size to it’s neighbour. Moreover it demonstrated that shrinkage not only produces a general scale error (one sheet being bigger than the next) but also an intra-sheet scale error (opposite edges of a single sheet being of different lengths).

The rather poor result of automatic scan registration
A manual method of edge matching was therefore used, whereby each sheet was carefully positioned against it’s neighbours. Where a general scale error was observed, minute magnification factors were applied in the relevant plane to line them up as closely as possible, while occasionally a whole sheet may be minutely revolved to agree with adjacent sheets Any remaining sliver along an edge was graphically filled. These final errors were perhaps the best illustration of the effect of differential shrinkage within a sheet, since they demonstrated that the loss of width between the top and bottom edges of a sheet was not linear.

Better scan registration following a manual fit and adjustments
Overall the scale factors applied were between 98.4 and 100.6%, and no rotation was greater than 1 degree. To put this in proportion to the real world, this meant that a sheet’s distortion may have caused it to lose up to 0.48m or gain up to 1.6m on the ground. The map was produced at a scale of 26” to the statute mile which is roughly 1:2500. This means that a 0.5 mm width on the original map, (a common width used for road edges for example) represent 1250 mm or 1.25m on the ground. The adjustments made are therefore on the cusp of what can be depicted at this scale, yet without them, the mismatch is vivid.
[1] Quoted by H Philips in an article entitled John Rocque’s Career ‘ in LTR Vol XX 1952
