The last post looked at how the single composite scan made from the 24 separate sheets of John Rocque’s 1746 map of central London, were fitted in place over moden mapping using the process named georeferencing. When applied to historic maps, this process will frequently distort their original orthogonal form, as the image is wrestled into its correct location. This posts examines a possible explanation of the warping that took place when the Rocque map was subject to this process.
England’s first national mapping agency – the Ordnance Survey – was founded in 1791, almost 50 years after the creation of Rocque’s central Londonmap. The first notable act of the OS was to carefully measure a baseline in Hounslow, westLondon, so that it could form the first part of a control network of survey points that would eventually cover the nation, and be the bedrock of every single map the OS produced of theBritish Isles until the advent of global positioning systems. The measurement was undertaken with the utmost care over two and half months, with glass rods – unaffected by variations in temperature – being used to measure the distance itself, and the termini of the line being marked by the careful sinking of de-commissioned cannon.
The procedure was so precise because the national control network was to be implemented using the method known as triangulation, and the success or fail of a triangulations rests on the accuracy with which it’s initial baseline was measured.
A triangulation (literally the making of triangles) begins with the measurement of a base line, and once this is established an instrument able to record horizontal angles is placed at the start of the line(A) and the other end sighted (B) . Then a point off the base line whose location is unknown is sighted (C), and the angle to it from the base line recorded. Next the instrument is moved to the other end of the base line (B), the start of the line sighted (A) and the same unknown distant point is sighted (C). With these two angles the measured distance of the baseline, and some trigonometry, you can calculate the lengths of the lines AC and BC and thereby the location of the unknown point. From these three known points, the same process can be repeated to coordinate further unknown points, which themselves become part of the network. For example set up on C, take a back-sight to B and sight a new point D etc.
Apart from the obvious benefit of being able to determine the location of points without visiting them, what makes the technique so strong and its discussion here relevant, is that within this network of triangles it is possible to re-measure or re-check the location of a point by viewing it from different points to those used for its initial coordination. In this way we can calculate multiple possible values for a point’s location, and from these repeated measures, may generate an average value. Since the differences in the measurements will be normally distributed (most values will be roughly the same but a few will be more and a few less) it allows us to state the amount of agreement or degree of error in the readings and identify values so far from the mean that they must be rejected.
The technique had first been applied in the mid 16th Century, and was used to great effect by various members of the Cassini family in their ground-breaking survey of France as well as smaller surveys in Britain and elsewhere, but by the start of the 18th century it had never been applied to the survey of a large metropolis. Rocque’s decision to utilise the technique to provide a check on the measurements made at street level, is recorded in his account of the map’s creation in a version published in 1747. The creation of the map was aided by;
“ascertaining the Position and Bearings of the Churches and other remarkable Buildings by Trigonometrical and other Observations from the Tops of Steeples, Towers and other Places, where such Buildings are visible; by taking the Angles at the Corners of Streets & c. with proper instruments, and measuring the Distances by the Chain: and by comparing from Time to Time, the Position of Places found by the last Method, with the general Observations before-mentioned. So as to correct the one by the other”
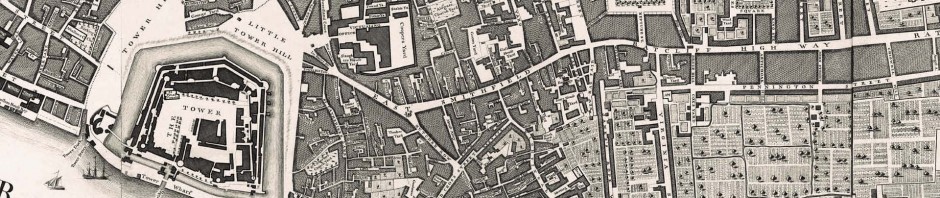
An image hidden in the margin of one of a latter map shows the intrepid surveyor – probably Rocque himself – balanced on ‘remarkable building’ and presumably aiming the telescope at another equally notable structure.

- Detail from John Rocque’s ‘Map of London and Ten Miles Around’ started in 1744
The application of these two fundamental survey tools by Rocque – repeated measures and independent checks – resulted in a notable false start. When distances calculated at street level with chain and theodolite, were found to contain major errors when compared with the same measurements calculated from the triangulation, he simply had to start the whole enterprise again.[1] Moreover, the application of triangulation to tighten-up the survey’s accuracy may explain the warping we see in the georeferenced map.
One could ponder how thorough Rocque was in his observations ; how many times was each angle measured, how powerful was the instrument, what sort of instrument calibration regime was followed and how did he accurately set up over an observation point? Indeed we could consider if the contemporary account of the lauded Jonathan Sissons theodolite Rocuqe used , as ‘..the best, most complete, handsome, and well designed instrument possible’ was in point of fact, true. Yet the most salient point here, is perhaps that if one is to use triangulation to check the accuracy of ground measurements, there has to exist suitable vantage points to use for the exercise. Church towers made the best observation point, and for the area covered by the 1746 Rocque map, c.62% of the parishes shown where within or directly adjacent to the City walls. Since each parish would typically have a single church within it, this would be a rich hunting ground for the tower-hungry tirangulator. Beyond this area lay the other 48%, but more poignantly, the parishes in the ‘neighbouring country’ as Rocque termed it, are on average 20 times larger than the first set. Thus, outside the core, there are fewer larger parishes, meaning fewer and poorer opportunities for triangulation measurements.
This lack of notable buildings outside the historic core would have greatly impeded the extension of Rocque’s triangulated checks to the South and East of the City particularly. It is therefore likely that more of the measured information in these areas would have been captured solely by chain and theodolite which we know from the survey’s false-start, would produce gross errors. It is in just these peripheral distance areas, that the warping effect is most marked and the quality of fit at it’s poorest.
[1] Unpublished research paper Jonathan Sisson and London’s 18th century mathematical instrument trade, Alex Werner,Museum ofLondon.
